I have recently been building an API using NestJS (Angular-like dev flow for writing Expressjs apps in TypeScript). While developing under Windows is pleasant enough, I was somewhat surprised at how painful deploying the application to IIS via IISNode can be. I quickly discovered that Nodejs applications often don’t behave identically when running under IISNode. I also quickly discovered that debugging an application running IISNode isn’t particularly straight forward in 2018. If you’ve found yourself reading this post, you’ve likely discovered as I have – that IISNode support in 2018 can be difficult to come by, despite IISNode still being a cornerstone to Nodejs support on Windows.
As I hit my first obstacles with IISNode, I of course fired up Google and started looking for guidance. While I found a number of posts and writeups detailing how to debug an IISNode hosted app, most of what I ran across was dated and seemingly no longer works. If you find yourself going down this rabbit’s hole, you will quickly find many threads on StackOverflow and github without any real resolution. I really started to sweat when I ran across the official original IISNode github repo – which has largely been abandoned for a number of years. (At least now the repo points you towards the slightly better maintained Azure fork due to a little Twitter exchange).
Since things do behave differently at times under IISNode, the ability to debug is crucial – and without it, I found myself debating rewriting my entire API to a stack more recently supported for IIS debugging. But before throwing the baby out with the bathwater, I figured I would try a couple more things to see if I could salvage my API codebase.
Since the documented debugging approach no longer seems to work, and since there are so many unanswered problems regarding this on StackOverflow and GitHub, I figured my time and energy was better served elsewhere. While perhaps a solution does exist to get the documented debugging approach working, many who have come before me have seemingly failed – and ultimately abandoned using IISNode as a result. I don’t want this to be me.
Developing a NodeJS application on Windows in VSCode is a very pleasant experience when running under NodeJS directly. Node module support in Windows by popular libraries has come a long way over the last several years – and so most things just work. Knowing that we already know and like the VSCode approach, I figured this was a good starting point – “get VSCode setup to debug an IISNode hosted application somehow”.
In reviewing the VSCode node debugging info, I ran across “Attach to Remote”. While my intent was to debug the staging environment locally in VSCode (vs remotely), I figured this was an approach that I’d not yet tried and so was at least worth a glance. I further assumed that VSCode wouldn’t particularly care if I was attaching to some remote IP or a local one, so long as I was checking off all of the required boxes.
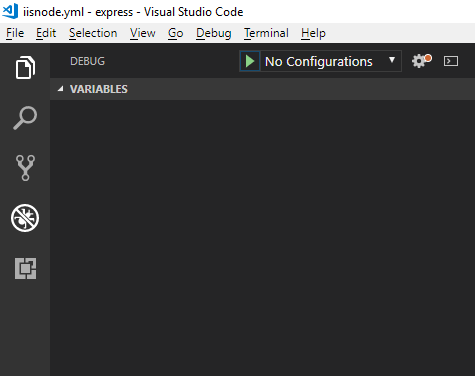
By default, VSCode doesn’t have any launch configurations setup for our project. Since there are no default configured launch profiles, you should find a screen similar to the following when you click on the ‘debugging’ icon (4th icon on the left menu). To get started, we need to create a launch.json, which will populate the debug dropdown currently displaying ‘No Configuration’.
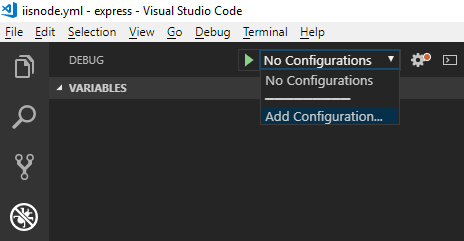
We can manually create the “.vscode/launch.json” file in the root of our project if we desire, but I’m going to let VSCode do that for me. Let’s start by clicking on the the dropdown that currently reads “No Configurations” – and then selecting “Add Configuration”, before finally selecting “Node.js” as our environment.
You should now be staring at the generated launch.json file, which most likely looks like the following screenshot.
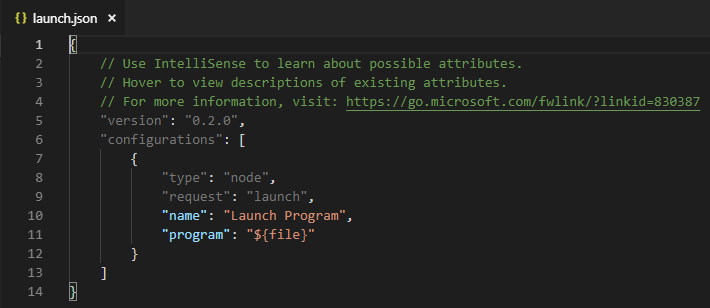
Since we’re just here to get debugging working, we’re just going to edit this configuration rule rather than creating a new one. We can begin by changing the value for “request” to “attach”. Let’s go ahead and update our name to something more accurate too – “Debug IISNode”. We can delete the “program” setting altogether. Now we need to add a few more settings – namely “address”, “port”, “localRoot” and “remoteRoot”. Some of these values will vary based on your local environment – see the screenshot below for mine.
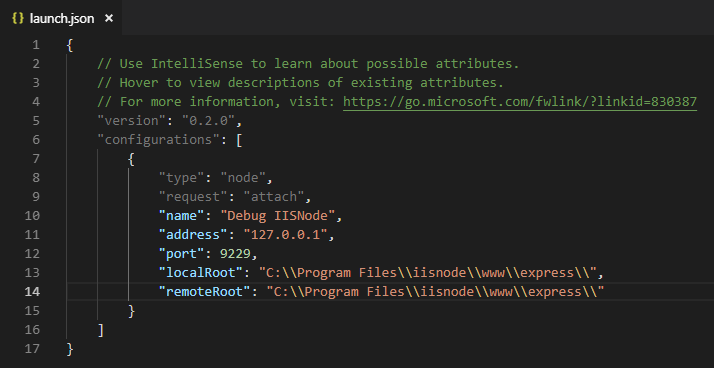
As you may have noticed when reading my “localRoot” and “remoteRoot” values, I am simply debugging against the express example that’s installed by the IISNode Full installer. You can debug any Nodejs application that you desire by updating these paths accordingly.
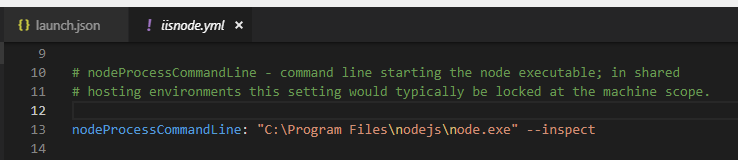
Since the Express example application doesn’t have a iisnode.yml, I’ve copied the one included in the ‘configuration’ example that was also installed by the IISNode Full installer. We will need to make a few modifications to the copied iisnode.yml to get things working like we want. First, we’re going to need to uncomment the “nodeProcessCommandLine” setting and ensure that the path is the correct node.exe path – we’re also going to want to add ‘–inspect’ following the closing quotation as you see in the screenshot below, as this is the glue that makes debugging possible.
Another change to the iisnode.yml setup that you will likely want to make is to make sure that ‘nodeProcessCountPerApplication’ is set to 1. By default, IISNode will spin up 1 node.exe instance per processor that you have on the machine – and so you may find some unnecessarily complications when debugging against 4 instances of your application at the same time.
While I am uncertain if this helps anything, I also like to update my iisnode.yml to disable the build in debugging which no longer seems to work in 2018. This is optional, and I have found that our VSCode debugging will work regardless – I just like to do this to eliminate any possible unwanted magic. I also, at least initially, like to enable logging in my iisnode.yml, as it can help identify startup issues happening before your logic is up and running (and hopefully logging).
With everything saved, it’s a good idea to restart out website in IIS. Truth told, this shouldn’t be required as changes to the web.config and iisnode.yml should trigger a reload, though I’ve previously ran into issues that I believe perhaps were related to not all changes being properly loaded, so I now just do this explicit restart for good measure.
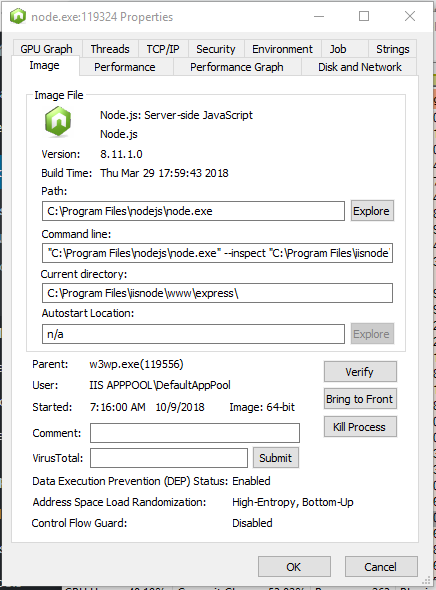
Now, using a tool like Process Explorer, we can inspect the node.exe instance that IISNode is using and see that it’s been launched with the “–inspect” flag.
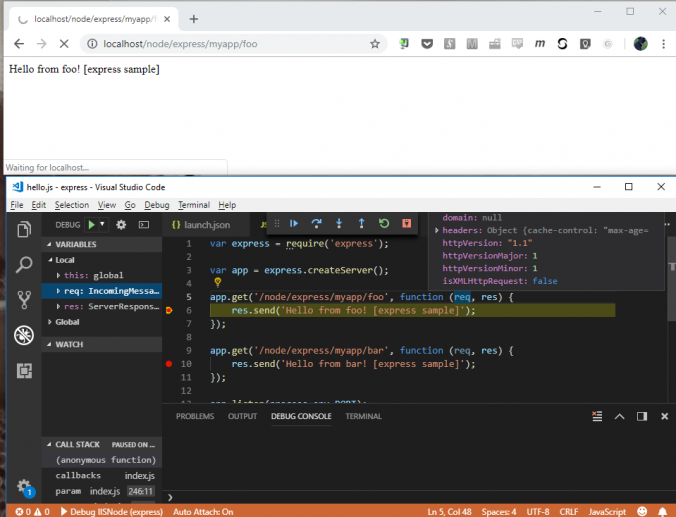
Now we just have to launch our new debugging config. Once it’s selected from the dropdown, we can either click the ‘Play’ button or press F5. Since we’re trying to debug, it’s probably a good idea to set a breakpoint or two.
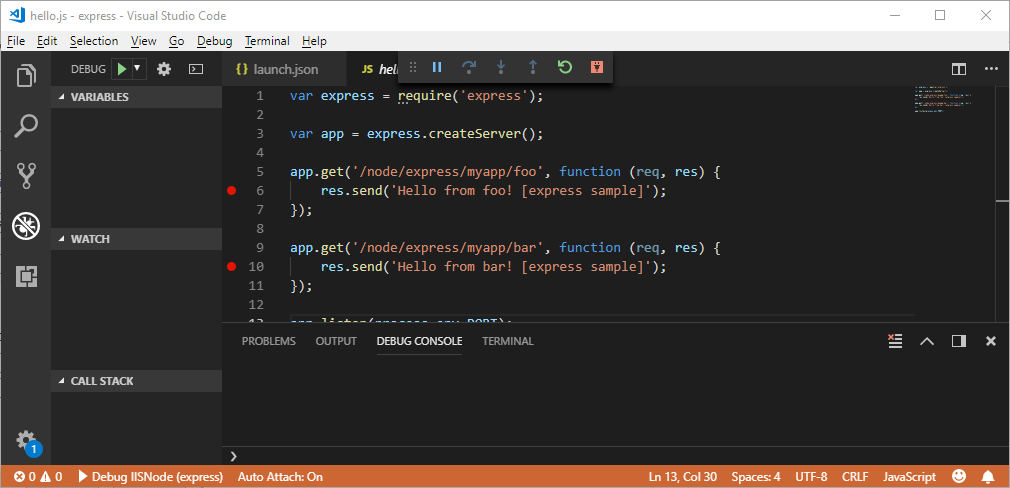
With the debugger attached, we can now visit our running application – once we hit a route associated with our breakpoints, we will find that we now have a fully functional debugging environment in VSCode for our IISNode handled application!

I didn’t see this documented elsewhere, and so figuring this out was a bit of a challenge – hoping that this saves a little bit of headache and heartburn!
-Matt