I'm Matt - You're here for my blog!

Author: mattezell (Page 2 of 3)

Thinkpad X1 Extreme Gen 2 – Popping Audio Problem and Solution

Introduction

tl;dr – The popping issue is likely caused by the audio device’s power-saving configuration – and so changing the configuration may eliminate the issue.

I wanted to do a ‘quick’ write up on the ‘audio popping issue’ that many Thinkpad owners have reported, as well as a solution/workaround. I recently purchased an X1 Extreme Gen 2 and quickly noticed the annoying popping issue once I got everything setup with my typical desktop arrangement – e.g. USB C dongle connected to HDMI, with external speakers connected to the LCD receiving the video/audio signal over HDMI. 

As many others have reported on various forums around the Internet, the issue essentially manifests as an audible popping noise, which is generally observed just before a sound begins playing or within a few seconds after the sound stops playing. People who play music/video all day often don’t even notice it, as the audio device never actually toggles power states as it is constantly active. The most common way to reproduce the issue when troubleshooting is ensuring that no audio has played for a few seconds, and then playing a short audio file such as a WAV – at which time an audible ‘pop’ may be heard before the sound plays and shortly after the sound finishes.

It’s worth noting that I already somewhat knew where to look to work around this issue, as pretty much every laptop I’ve purchased in the last decade have had this popping issue in one way or the other – and the approach described in this post has by far been the most successful for me in addressing this issue on the various laptop models on which I’ve encountered it.

Overview of Issue

At the heart of this issue is power management settings coupled with hardware operational realities. Within the registry are various settings responsible for controlling the various devices within your computer (amongst other things) – some such settings are ones dealing with how devices are handled when not considered as being in use. For audio devices, this is generally 3 settings:

ConservationIdleTime – this setting controls how long to wait before the device is considered idle when the power management is in a conservation state.

IdlePowerState – What state should the device be moved to when either of the idle time windows has been met.

PerformanceIdleTime – this setting controls how long to wait before the device is considered idle when the power management is in a performance state.

So, essentially our registry is saying “depending on the current power management mode of the PC, change the power state of this device to something else after a period of time of inactivity has passed”.

Unfortunately, this powering down of an audio device isn’t as smooth as we’d often hope. Due to the powering down and powering up of the device, there’s often an audible pop associated with the power state change – and so we’re seeking to eliminate the power state change in order to eliminate the associated popping noise.

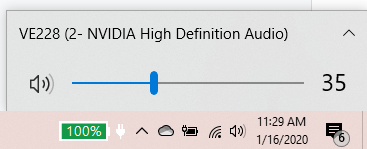
Most computers have multiple audio devices – and often all of those devices are affected by this popping issue, though not always. In this writeup, I’m going to focus on the audio device that I am actively using and having this issue with – and I may, at a later time go adjust the others if I identify a need to do so. In my specific situation, I’m using the NVidia High Definition Audio via HDMI – and so we will focus on that.

Screenshot showing NVIDIA High Definition Audio being used

Modifying the Registry

WARNING: You can mess up your PC via the registry, so proceed with caution when using regedit.

When working with the registry, you’re likely to find a lot of key/value collections that appear to be the same if you go searching around – and this is because they are, as the registry actually uses pointers to find the active setting in play. Ultimately, we’re concerned with ‘CurrentControlSet’ as this is the collection pointing towards the actual settings. 

Here is my registry path for the targeted audio device (NVIDIA High Definition Audio):

Computer\HKEY_LOCAL_MACHINE\SYSTEM\CurrentControlSet\Control\Class\{4d36e96c-e325-11ce-bfc1-08002be10318}\0001\PowerSettings

Note: I will provide all matching collections at the end of this document for reference.

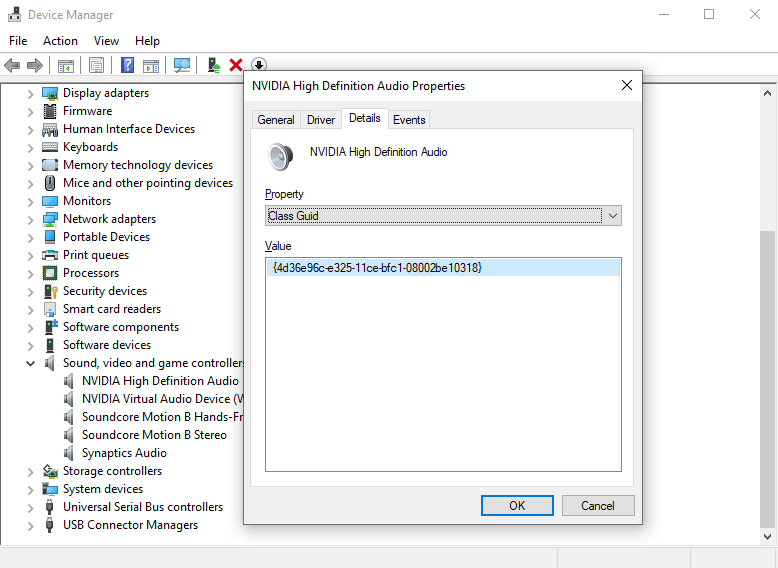
Since I am currently experiencing the popping issue on the NVidia High Definition Audio interface, I’m going to focus on the PowerSettings in the CurrentControlSet for this specific device. To ensure that we’re modifying the correct part of the registry, we can check out our device in Device Manager and ensure that our Class Guid matches the GUID in our registry path (e.g. 4d36e96c-e325-11ce-bfc1-08002be10318):

Confirming Matching Class GUID in Device Manager vs Registry Path

What we’re seeking to accomplish here is to prevent Windows from putting this audio device into power saving mode – as ultimately it is the power saving mode that’s causing the audible pop when a sound isn’t actively being played.

Here are additional details on this topic: 
https://docs.microsoft.com/en-us/windows-hardware/drivers/audio/audio-device-class-inactivity-timer-implementation

https://docs.microsoft.com/en-us/windows-hardware/drivers/kernel/device-power-states

As you may have inferred from the Device Power States document, a state of D0 is the ‘working state’ and D1, D2 and D3 states are various power-saving modes supported by the device.

When looking at our registry configuration, we see the following:

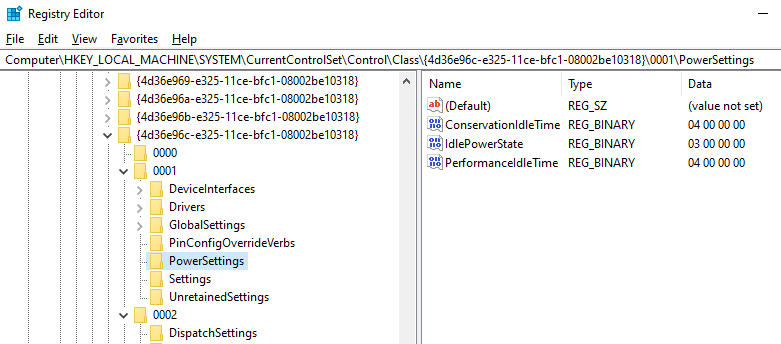
As one may have expected, we see the IdlePowerState for this device is 03, which corresponds with D3 – the most aggressive of the various power-saving states. D3 essentially cuts the device off – it’s this cutting off that results in the audible pop. With consideration of all of the applicable settings here, we’re seeing “when in conservation mode and in performance mode, consider 4 seconds the idle time – when 4 seconds has passed, set the device’s power-saving mode to D3”.

I’m going to go a bit of overkill here by setting the idle time to something that won’t be realistically hit in normal usage, as well as setting the idle mode to ‘working state’ (D0).

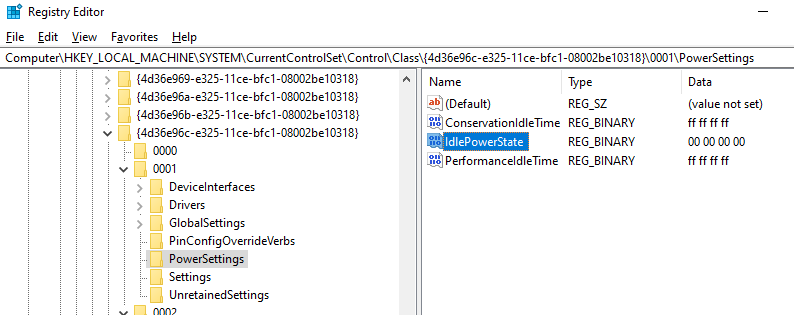
As you can see in the above screenshot, I’ve set the idle times to FF FF FF FF – which translates to 4294967295 decimal, and since this setting is for seconds it means we’ve made it so that 49,710 days must pass before this device is considered idle… As can also be seen from the screenshot, we’ve changed the Idle Power State from D3 to D0 – so even if the idle time is hit, the device should remain in the active D0 state.

After making our changes, we simply need to reboot the PC for them to go into effect. Note: We’re only making changes for Windows, so if you’re experiencing this issue under Linux then you will need to perform similar operations to change how the driver handles power management there.

Conclusion

After making the discussed changes, my pops have essentially gone away. Now I only notice a pop the first time the speakers become activated in my Windows session, as well as when shutting down. 

I figure that it’s logical to assume that this may have an impact on battery life since we’ve essentially disabled power management for this audio device, though I am not certain how severe this impact is. 

I also don’t know what other side effects this change may have on your system – so proceed with caution, with the understanding that I am not responsible for you borking your system 🙂 As mentioned, I’ve done this on multiple laptops over the years and they are all still functional.

Good luck!
-Matt

Misc

All Registry Matches on my Thinkpad X1 Extreme Gen 2

Nvidia High Definition Audio

Computer\HKEY_LOCAL_MACHINE\SYSTEM\ControlSet001\Control\Class\{4d36e96c-e325-11ce-bfc1-08002be10318}\0001\PowerSettings

Synaptics Audio

Computer\HKEY_LOCAL_MACHINE\SYSTEM\ControlSet001\Control\Class\{4d36e96c-e325-11ce-bfc1-08002be10318}\0002\PowerSettings

Audio Device on High Definition Audio Bus

Computer\HKEY_LOCAL_MACHINE\SYSTEM\ControlSet001\Control\DeviceMigration\Devices\HDAUDIO\FUNC_01&VEN_14F1&DEV_1F86&SUBSYS_17AA229F&REV_1001\4&270001c&0&0001\Driver\PowerSettings

NVIDIA High Definition Audio

Computer\HKEY_LOCAL_MACHINE\SYSTEM\CurrentControlSet\Control\Class\{4d36e96c-e325-11ce-bfc1-08002be10318}\0001\PowerSettings

Synaptics Audio

Computer\HKEY_LOCAL_MACHINE\SYSTEM\CurrentControlSet\Control\Class\{4d36e96c-e325-11ce-bfc1-08002be10318}\0002\PowerSettings

Audio Device on High Definition Audio Bus

Computer\HKEY_LOCAL_MACHINE\SYSTEM\CurrentControlSet\Control\DeviceMigration\Devices\HDAUDIO\FUNC_01&VEN_14F1&DEV_1F86&SUBSYS_17AA229F&REV_1001\4&270001c&0&0001\Driver\PowerSettings

Audio Device on High Definition Audio Bus

Computer\HKEY_LOCAL_MACHINE\SYSTEM\Setup\Upgrade\PnP\CurrentControlSet\Control\DeviceMigration\Devices\HDAUDIO\FUNC_01&VEN_10DE&DEV_0094&SUBSYS_17AA229F&REV_1001\5&2353385e&0&0001\Driver\PowerSettings

Audio Device on High Definition Audio Bus

Computer\HKEY_LOCAL_MACHINE\SYSTEM\Setup\Upgrade\PnP\CurrentControlSet\Control\DeviceMigration\Devices\HDAUDIO\FUNC_01&VEN_14F1&DEV_1F86&SUBSYS_17AA229F&REV_1001\4&270001c&0&0001\Driver\PowerSettings

Intel High Definition Audio

Computer\HKEY_LOCAL_MACHINE\SYSTEM\Setup\Upgrade\PnP\CurrentControlSet\Control\DeviceMigration\Devices\INTELAUDIO\FUNC_01&VEN_14F1&DEV_1F86&SUBSYS_17AA229F&REV_1001\4&270001c&0&0001\Driver\PowerSettings

Taking the New Windows Terminal for a Spin

If you’re a techie, you’ve probably heard of the shiny new Windows Terminal. While not currently available via an official Microsoft build, I decided to give it a spin – which, due to Microsoft’s commitment to Open Source over the last handful of years, is now possible!

4 realz – they do!

Essentially, the new Windows Terminal is a wrapper application of sorts that allows for a tabbed CLI interface for all supported command line environments within Windows. Bash (via WSL)? Check! Powershell? Check! Old faithful CMD? Check, check and check!

Of course, unifying all CLIs isn’t sexy enough for Microsoft in 2019 – no sir! In addition to providing an all-in-one interface for the various CLIs now running under Windows, a slew of customization features have been added as well – with more currently in the pipeline for the coming releases.

This post isn’t intended to be an installation/build tutorial, but instead is more of a fluff piece detailing my personal experiences getting up and running, as well as a couple of tips and tricks picked up in my little bit of time spent tinkering.

I was able to get running relatively easily. I found the official readme instructions for the project pretty solid – getting me 99% of the way there. If you’ve not tried, I’d recommend visiting the Github link and checking out the Getting Started section: https://github.com/microsoft/terminal#getting-started

One of the first things you’re likely to notice is the requirement to be on Windows build 1903 ( >= 10.0.18362.0). Though by no means complicated, this was by far the longest part of the setup for me. Initially my efforts to manually download and install the build update proved fruitless, largely due to me having missed a required incremental update between what I was running when I started and 1903. Fortunately, a couple of quick Googles revealed that mere mortals, such as myself, could use the built in Windows Update to get to 1903 – once I got all of the required updates in place, I was eventually presented with the option to install 1903.

After getting Windows 10 up to 1903, I realized that I didn’t have Visual Studio proper on my newest dev machine – this proved to be the next longest part of the process. Having been using VSCode exclusively for the last year+ doing Angular dev (and in part due to no longer having a personal MSDN), I’d just not found a need for Visual Studio until now. Being a bit out of the loop on the IDE, I decided to go with the latest and greatest – installing 2019 Community.

There you have it – the bulk of the technical work. 1) upgrading Windows 2) installing Visual Studio. With these two time sinks out of the way, I was able to follow the rest of the instructions pretty much directly and get a working build (note: as mentioned in the readme, I was prompted to install some additional tooling as a result of opening in 2019, but this was seamless and handled automatically by VS).

The observant observer is probably thinking “Well… Okay… Lots of words to essentially say ‘I did it by reading the linked instructions’… Why am I reading your post?” Well, let me ask you a couple of questions, in turn, observant friend… Do you like running your app after building? Do you like animations in your CLI to breakup the mundane monotony of executing command after command? Well, then you’ve come to the right place! Keep going!

Running Windows Terminal

If you’re like me, you found yourself doing a victory lap after CTRL+Shift+B didn’t blow up your PC. If you’re like me, then you likely found yourself scratching your head about which one of the many build output artifacts you should be haphazardly clicking on in order to see your awesome new Windows Terminal. The answer: “None of them”. Something that wasn’t quite clear to me was that the application actually needs to be locally deployed in order to properly run. To deploy, simply right-click the ‘CascadiaPackage’ project and then click ‘Deploy’. Note: If you’re following the instructions, you’ve enabled Developer Mode, which is required – if you’re not following the instructions, then shame on you.

Deploy == Install

Once deployed, you should be able to locate “Windows Terminal (Dev Build)” in your Start menu.

There it is! Isn’t it beautiful?!

Okay, great! We have a terminal!!! But… we already had a terminal (or few)… So what?

Multiple CLIs – One Windows Terminal

Towards the top right of your terminal window, you should see a ‘+’ and down arrow. Fortunately for me, Windows Terminal picked up all of my currently installed CLIs – PowerShell, CMD and Ubuntu Bash via WSL. If I want to open up another instance of the default CLI (PowerShell for me), I can simply click the ‘+’ and it will open a new tab with a new CLI instance! Additionally, key bindings are likely similar to what you’re used to in other apps – CTRL+T to open a new tab, and CTRL+W to close the current tab.

You can also click the down arrow in order to get a drop-down list of all of the configured CLIs – selecting one to open an instance of that CLI in a new tab!

So many CLIs!

But what if Windows Terminal didn’t pick up all of my CLIs? Or what if I add additional CLIs (say via different Linux subsystems)? Enter ‘Settings’. When you click settings, you’re likely to be prompted for which viewer/editor you would like the profile config file to be opened with – in my case, I just went with the suggestion default of VS Code. Once open, you will see a JSON file containing the default configuration for Windows Terminal similar to the following:

profile.json / config

By scrolling down, you can find the individual CLI profiles – here are a couple of mine:

CLI configurations

While I’m not 100% of the various configuration properties, I’ve learned enough to be dangerous – I’ve learned enough to set things on fire… But we will talk about burning the house down shortly – for now, back to the topic at hand. If your desired CLI isn’t automatically found, you can easily configure it by copying/pasting one of the existing configurations as a new ‘profiles’ entry, and then modifying the commandline and other relevant properties to suit your needs! Easy peasy!

Animate All The Things!!!

Image result for Animate all the things

So back to setting things on fire… Odds are you found yourself going down this rabbit hole not out of your hate of having multiple windows open, but instead because you like shiny new things as much as I do. Odds are you probably saw a really cool demo showing fancy color schemes and backgrounds and thought “holyfugginshizbawls! I can haz animated CLIs too?!”. Well, as fate would have it, you can! While I again am not 100% on all of the configuration possibilities, I’ve fumbled around enough to figure out how to animate my various CLI instances – which I will share with you here.

To get started, we need a new property in our profile config – “backgroundImage”. This string value may point to a local image file, or (best I can tell) any network accessible image file that your little heart desires… But who really cares about regular old static images anyways? What is this? 1999? Fortunately, not only are static images supported but so are ANIMATED GIFS!!! By setting the value of this property to a path string to an animated gif, we are enabled to razzle-dazzle all inferior onlookers with our clearly superior terminal.

Behold and be amazed!

RAZZLE-FREAKING-DAZZLE!

Another setting of interest is ‘backgroundImageOpacity’, which (hold on to your seats!) allows you to set the opacity of the CLI instance’s background. Here’s my PowerShell configuration rocking the synthwave:

CLI Profile Example

Something that’s worth noting, and something I don’t yet fully understand – ‘useAcrylic’ in relation to using ‘backgroundImage’. In my experiences thus far, I must set useAcrylic to false in order to set a background image and have it actually load – when set to true, my CLI instance seems to fall back to simple color configurations (with Acrylic’s glassy transparency goodness, of course).

Here Be Dragons

So far, I am digging the new Windows Terminal. That said, it’s not been the most stable of experiences for me personally. As I’ve tinkered, I’ve found myself in a non-operational state multiple times with the Windows Terminal – at which time a full reboot has been my only discovered recourse. I’ve not quite nailed down what causes the ‘Abort’ crash – so far, it just seems to happen after the Windows Terminal has been up and running for some unknown period of time. Eventually, Windows Terminal will vanish, with an error dialog indicating a problem – with the process crashed, there’s no process to terminate, but subsequent attempts to relaunch will result in the same error message being displayed until reboot… more to come.

Anywhos. I hope that you’ve enjoyed reading about the Windows Terminal as much as I’ve enjoyed learning about it! Happy tinkering!
-Matt

The Magical Power of NestJS

Today I wanted to make a quick post about a framework/toolset that I’ve become increasingly fond of – NestJS. For those not in the know, NestJS enables developers to write Express APIs (and more) in a very Angular-ish way, including coding in TypeScript.

NestJS - A progressive Node.js web framework

My adventures into NestJS began, as one could logically assume, with a need for a new API. Having been deeply submerged in Angular-land for several years now, NestJS looked like it was at least worth a peek – and after a peek, we decided it was a perfect fit and so we adopted it.

High-level, we needed an API to essentially wrap some node, npm and Angular CLI processes so that they could be interfaced with by clients via REST. All in all, the API writing process was very straight forward – a controller exposing our business concepts, which performed various node, npm, and Angular CLI operations via dedicated service implementations.

All in all, the writing experience was very pleasant with NestJS – but as often happens with enterprise projects, the target appeared to be moving pretty late in the game as requirements imposed by external players changed.

“Okay. Great. So now we have this REST API, but we’ve since decided that a CLI would be a better fit. Oh, and we needed it yesterday…”


If you’ve ever been a developer in a large organization, you know this sort of thing happens far more often than you’d generally prefer – but it’s life. Things change – lots of moving parts, lots of cooks in the kitchen, etc.

Behind schedule and over budget due to things that were outside of my control, I found myself considering a frantic rewrite of the API. Logically, my mind quickly moved to ‘how much of the API codebase can we leverage in our CLI’, as I opened up the NestJS docs in the hopes that I’d find my magical answer.

After a bit of hunting, I found ‘Application Context’: https://docs.nestjs.com/application-context

From the NestJS docs:

There are several ways of mounting the Nest application. You can create either a web app, microservice or just a Nest application context. Nest context is a wrapper around the Nest container, which holds all instantiated classes. We can grab an existing instance from within any imported module directly using application object. Hence, you can take advantage of the Nest framework everywhere, including CRON jobs and even build a CLI on top of it.

Perfect – this sounds to be just what the doctor ordered.

Having played with NestJS quite a bit, and being familiar with the transpilation process, I knew I’d essentially get a one-to-one output of my TS implementations in JS. Not wanting to change my API in a way that detracted from using the codebase as a REST API, I instead opted to add another entry point – adding ‘main.cli.ts’ alongside of the NestJS generated main.ts, in which I added my CLI specific logic.

Fortunately, having coded my API with abstractions / separation of concerns the best that I knew how, I had domain specific implementations wrapped in services rather than directly in controllers – this made my CLI experiment a dream rather than a nightmare. With just a few lines of new code in my main.cli, I was able to invoke my service logic from the command line – passing arguments at the CLI rather than properties in a POST body.

> node dist\main.cli.js --id 1

BOOM! DONE!

I honestly found myself blown away by the simplicity of this undertaking. Anxiously considering more or less a full rewrite initially, I found myself empowered by NestJS to fundamentally change my program, additively, in a matter of minutes – rather than the hours or days it would have required to do a full rewrite. With a dozen-or-so lines of new code, I now not only have a fully functional REST API, but I also have a CLI capable of doing the same things as the API.

Image result for magic gif


If you’ve not used NestJS before, I definitely recommend that you give it a look before you write your next API (or CLI)!
https://nestjs.com/
https://twitter.com/nestframework

-Matt


Playing with Docker on Windows 10 with Live Reload (nodemon)

Image result for what year is it

I know. I know. I’m a bit late to the game – and this was long overdue…

For a few years now, I’ve been fully submerged in the world of Enterprise Angular development – which has unfortunately led to me falling behind on some technologies, such as Docker. While I’ve been aware of LXCs for many, many years now, I’d not gotten past 101 setup tutorials for Docker to date – which changes today.

This post details my initial journey with running my first Docker container based Node.js application under Windows 10 – as well as the challenges encountered with live reload via nodemon during the journey, and how I got everything working well enough in the end.

As is often the case, I went looking for a recent basic getting started writeup, which led me to Dinushanka Ramawickrama’s “Let’s Dockerize a Nodejs Express API“. Being a huge fan of Node.js, often choosing it as my stack of preference, this seemed like a great place to start – taking a Node Express API and shoving it into a container using Docker.

All in all, I have to say that Dinushanka’s write up is pretty good – short, to the point, easy to follow, and accurate. It wasn’t until getting the last section, titled “Dynamically Change the Contents of the Running Container using Nodemon.”, that I ran into problems – for the life of me, I could not get live reload via nodemon to work as expected. Docker would output log messages seemingly indicating that all was well, but when I’d make changes to my server they weren’t syncing in my Docker container.

nodemon reporting for duty – but the duty never shows

As I often do in situations like this, I turned to the comments – assuming that someone else had already experienced my pain and provided me a nicely packaged solution. Nope – not this time. So I went searching, which led me to a relatively recent issue on nodemon’s github repo:
https://github.com/remy/nodemon/issues/1447 . As suggested by a commenter, I checked out “Application isn’t restarting” in the nodemon readme –
https://github.com/remy/nodemon#application-isnt-restarting . Going for the low hanging fruit approach, I updated my package.json’s dev script to include the Legacy Watch flag:


Now, all that was left was to rebuild my image and rerun it:

> docker-compose down
> docker-compose build
> docker-compose up

With the above in place, all was well in the world – containerized live reloading node development. AIN’T LIFE GRAND?!

Long story short, essentially the mechanisms leveraged on Linux systems to detect filesystem changes aren’t available in Windows – and so live reload doesn’t work out of the box. Fortunately, nodemon’s Legacy Watch uses a different (though more costly) polling mechanism to detect changes – which works fine for our purposes of ‘getting started’. Note: this is actually a known issue, as you can see in the Docker official docs:
https://docs.docker.com/docker-for-windows/troubleshoot/#inotify-on-shared-drives-does-not-work

It’s worth mentioning that some folks have reported this issue when developing on host Linux systems, which is believed to be related to inotify-tools not being present in the OS image used to create your container. In these cases, your nodemon woes may be solved by simply updating your Dockerfile with an additional run statement to install the package using the container OS’ package manager. See here:
https://stackoverflow.com/questions/42445288/enabling-webpack-hot-reload-in-a-docker-application/46804953#46804953

-Matt

Sain Smart / Creality3d Ender 3 Firmware Update on v1.1.4 Board

So, you’ve recently bought an Ender 3, as I have. After reading up, you’ve decided to take the plunge and upgrade your firmware to Marlin. You open up your box as you’ve seen in countless YouTube videos – but something’s different from any of the videos that you’ve seen. Instead of 1.1.2 or 1.1.3, your board says “Creality3d V1 1.4” (1.1.4)!

If you find yourself frantically searching Google, only to find yourself coming up empty handed on instructional videos that explicitly mention v.1.1.4, I’m happy to announce that the firmware upgrade process is exactly as covered in the 1.1.2/1.1.3 videos and tutorials. I have now successfully completed the firmware update to Marlin TH3D_UFW_U1.R2.9a.

As all of the recommended tutorials cover, I had to first flash the bootloader using my UNO before being able to directly update the Ender 3’s firmware via USB. I’ve seen some Amazon sellers indicate that their v.1.1.4 board is already loaded with a bootloader, but I was unable to properly connect to the Ender 3 until I first loaded the bootloader – YMMV.

These are the videos that I consulted:

Bootloader Flashing Guide 2019 – CR-10/Ender 2/Ender 3/Ender 5/X3S/X5S/Wanhao i3 – 1284p Boards

TH3D Unified Firmware Setup Guide – Stock, EZABL, EZOut and More!

Ender 3: How to install a bootloader and update firmware

Good luck!

Installing Node.js in the Ubuntu Windows Linux Subsystem

Installing Node.js in the Windows Linux Subsystem (WLS) is quick and easy – accomplished by essentially running 2 commands. By reading the official Node.js docs, we can see that Ubuntu installs are provided via NodeSource. Once at NodeSource, we see the commands required for Debian based Linux systems, such as Ubuntu (as of the time of this writing, I am running the Ubuntu 18.04.01 LTS subsystem).

First, we need to pull down the installer script and execute it using a 1-liner:

curl -sL https://deb.nodesource.com/setup_11.x | sudo -E bash -

A bit about the command that we just ran. As you’re likely already aware, curl is a command line utility for interfacing with various protocols – in this case, http(s). If so inclined, you can take a look at the contents of the “setup_11.x” bash script. So, as you know, we’re working with a bash script – which we’re pulling down with the assistance of curl, but rather than saving it to our local filesystem, we’re piping it’s contents to bash, which we’re elevating using sudo. As you may have noticed, we’re actually calling “sudo -E”, which instructs sudo to preserve environmental variables while executing. So we call “bash -” as administrator, that training dash instructing bash “take the input from the pipe and treat the contents of a bash script”. By inspecting the output, or better yet from reading the bash script, we can see that we’re essentially modifying our apt sources to allow us to ‘apt install’ Node.js using the NodeSource repo. Easy peasy.

sudo apt-get install -y nodejs

With our apt sources updated to include the NodeSource repo, we use “apt-get install” to install nodejs – just as we would any apt package. Just as is the case with other apt installed packages, apt will evaluate all required dependencies for Node.js and install them on your system as needed before installing the Node.js binary.

Once installation has completed, you should be able to execute “node -v” and “npm -v” to see your installed versions.

We now have a fully functional Node.js environment in our Windows Linux Subsystem!

Lunar Eclipse – January 20th, 2019

Not much of a post, but I wanted to share (with all 2 of you) anyways.

Like much of North America, I spent the later part of my Sunday evening staring slack-jawed at the sky to witness the full lunar eclipse and blood moon.

Space never ceases to amaze.

Here are a few pictures that I captured during the eclipse – taken with my old S3IS, as well as my el cheapo Bushell 1.25″ telescope coupled with my S9+.

Enjoy (in all of their amateur blurriness)!

IISNode – Modern Debugging via VSCode

I have recently been building an API using NestJS (Angular-like dev flow for writing Expressjs apps in TypeScript). While developing under Windows is pleasant enough, I was somewhat surprised at how painful deploying the application to IIS via IISNode can be. I quickly discovered that Nodejs applications often don’t behave identically when running under IISNode. I also quickly discovered that debugging an application running IISNode isn’t particularly straight forward in 2018. If you’ve found yourself reading this post, you’ve likely discovered as I have – that IISNode support in 2018 can be difficult to come by, despite IISNode still being a cornerstone to Nodejs support on Windows.

As I hit my first obstacles with IISNode, I of course fired up Google and started looking for guidance. While I found a number of posts and writeups detailing how to debug an IISNode hosted app, most of what I ran across was dated and seemingly no longer works.  If you find yourself going down this rabbit’s hole, you will quickly find many threads on StackOverflow and github without any real resolution. I really started to sweat when I ran across the official original IISNode github repo – which has largely been abandoned for a number of years. (At least now the repo points you towards the slightly better maintained Azure fork due to a little Twitter exchange).

Since things do behave differently at times under IISNode, the ability to debug is crucial – and without it, I found myself debating rewriting my entire API to a stack more recently supported for IIS debugging. But before throwing the baby out with the bathwater, I figured I would try a couple more things to see if I could salvage my API codebase.

Since the documented debugging approach no longer seems to work, and since there are so many unanswered problems regarding this on StackOverflow and GitHub, I figured my time and energy was better served elsewhere.  While perhaps a solution does exist to get the documented debugging approach working, many who have come before me have seemingly failed – and ultimately abandoned using IISNode as a result. I don’t want this to be me.

Developing a NodeJS application on Windows in VSCode is a very pleasant experience when running under NodeJS directly. Node module support in Windows by popular libraries has come a long way over the last several years – and so most things just work. Knowing that we already know and like the VSCode approach, I figured this was a good starting point – “get VSCode setup to debug an IISNode hosted application somehow”.

In reviewing the VSCode node debugging info, I ran across “Attach to Remote”.  While my intent was to debug the staging environment locally in VSCode (vs remotely), I figured this was an approach that I’d not yet tried and so was at least worth a glance. I further assumed that VSCode wouldn’t particularly care if I was attaching to some remote IP or a local one, so long as I was checking off all of the required boxes.

By default, VSCode doesn’t have any launch configurations setup for our project. Since there are no default configured launch profiles, you should find a screen similar to the following when you click on the ‘debugging’ icon (4th icon on the left menu). To get started, we need to create a launch.json, which will populate the debug dropdown currently displaying ‘No Configuration’.

No Launch Configuration

We can manually create the “.vscode/launch.json” file in the root of our project if we desire, but I’m going to let VSCode do that for me. Let’s start by clicking on the the dropdown that currently reads “No Configurations” – and then selecting “Add Configuration”, before finally selecting “Node.js” as our environment.

Adding a new configuration.

You should now be staring at the generated launch.json file, which most likely looks like the following screenshot.

Generated launch file

Since we’re just here to get debugging working, we’re just going to edit this configuration rule rather than creating a new one. We can begin by changing the value for “request” to “attach”.  Let’s go ahead and update our name to something more accurate too – “Debug IISNode”. We can delete the “program” setting altogether. Now we need to add a few more settings – namely “address”, “port”, “localRoot” and “remoteRoot”.  Some of these values will vary based on your local environment – see the screenshot below for mine.

Debug config in launch.json

As you may have noticed when reading my “localRoot” and “remoteRoot” values, I am simply debugging against the express example that’s installed by the IISNode Full installer.  You can debug any Nodejs application that you desire by updating these paths accordingly.

Since the Express example application doesn’t have a iisnode.yml, I’ve copied the one included in the ‘configuration’ example that was also installed by the IISNode Full installer. We will need to make a few modifications to the copied iisnode.yml to get things working like we want. First, we’re going to need to uncomment the “nodeProcessCommandLine” setting and ensure that the path is the correct node.exe path – we’re also going to want to add ‘–inspect’ following the closing quotation as you see in the screenshot below, as this is the glue that makes debugging possible.

Setting up nodeProcessCommandLine to inspect

Another change to the iisnode.yml setup that you will likely want to make is to make sure that ‘nodeProcessCountPerApplication’ is set to 1. By default, IISNode will spin up 1 node.exe instance per processor that you have on the machine – and so you may find some unnecessarily complications when debugging against 4 instances of your application at the same time.

While I am uncertain if this helps anything, I also like to update my iisnode.yml to disable the build in debugging which no longer seems to work in 2018.  This is optional, and I have found that our VSCode debugging will work regardless – I just like to do this to eliminate any possible unwanted magic. I also, at least initially, like to enable logging in my iisnode.yml, as it can help identify startup issues happening before your logic is up and running (and hopefully logging).

With everything saved, it’s a good idea to restart out website in IIS. Truth told, this shouldn’t be required as changes to the web.config and iisnode.yml should trigger a reload, though I’ve previously ran into issues that I believe perhaps were related to not all changes being properly loaded, so I now just do this explicit restart for good measure.

Now, using a tool like Process Explorer, we can inspect the node.exe instance that IISNode is using and see that it’s been launched with the “–inspect” flag.

Inspecting node.exe to see the ‘–inspect’ flag

Now we just have to launch our new debugging config.  Once it’s selected from the dropdown, we can either click the ‘Play’ button or press F5. Since we’re trying to debug, it’s probably a good idea to set a breakpoint or two.

With the debugger attached, we can now visit our running application – once we hit a route associated with our breakpoints, we will find that we now have a fully functional debugging environment in VSCode for our IISNode handled application!

Hitting a breakpoint in VSCode!

I didn’t see this documented elsewhere, and so figuring this out was a bit of a challenge – hoping that this saves a little bit of headache and heartburn!

-Matt

Angular Secure Package – An Update

Howdy again, lone reader (okay.. there’s actually 2 of you…)!

I’ve recently continued to work with Angular 6 and have really enjoyed the updated experience!  As mentioned in the last post, I’d recently been presented with the challenge of finding a way to secure the implementation details of a library in a way that continued to support JIT and AOT builds.

As previously discussed, while some success was found with Angular 4 using Rollup, I could never get a single package capable of JIT and AOT – and instead had to rely on a process of generating 2 packages (one for our builds and one for 3rd party devs). And as previously discussed, I’ve found this process to be much more streamlined in Angular 6 due to the first class library generation support that Angular 6 brought to the table via ng-packagr.

About a week ago, at the request of a Google Engineer by the name of Alex Rickabaugh, I created a feature request for a documentation enhancement found here: https://github.com/angular/angular/issues/24580.

Today I figured I would create a minimal project to demonstrate the approach. Feel free to check it out and let me know what you think! https://github.com/mattezell/SecureAngularLibrary

Until next time!
-Matt

Creating a ‘Secure’ Angular Library Package – Here Be Dragons

Background/Motivations

I am an an enterprise architect who currently calls the arena of Fintech home. Years ago, we set out to modernize our main client facing systems and their supporting APIs. For the front end, we set our targets and AngularJS and didn’t look back. Our challenge wasn’t a small one – coming from a .Net and Java heavy world in terms of our existing code bases, part of our systems included a 3rd party ecosystem which allowed partner developers to extend our base functionality. Not only could partner developers extend the system’s core functionality, but they could also package up their extensions in a manner compatible with our systems so that they could be resold to other organizations who also benefited from this new functionality.

The initial release of our revamped, albiet feature-limited system, was very well recieved – and almost immediately the ecosystem began to grown around it at a pace nearly exceeding our ability to continue to build out our initial system… A good problem to have – and so we continued to iterate and release.

As anyone who works in “Enterprise Development” knows, IP is an important point of focus – companies often require first and foremost that trade industries be protected, and that key implementation details be locked away under lock and key. Of course due to the core realities of JavaScript, this posed us an interesting challenege – in that you’re highly limited in the ways that you can protect your propritary logic without breaking things. But ultimately we persisted and prevailed – obfuscation and minification got us past our requirements so that we could forge ahead with our new stack based on ‘web technologies’.

For our system, which was based on AngularJS 1.5, we found the decorator pattern to suit us quite nicely when faced with the requirements of ‘code protection’. Using the decorator pattern, we were able to provide developer guidance documents which served to expose extenibility points via documentation. While less than perfect, it worked pretty well for us and our clients – particularly when you consider the reality of JavaScript development, where API documentation was king, vs TypeScript development, where Typings are king (and more or less a requirement).

Fast foward a year+ and several iterations later, we found ourselves with a functional codebase now ported to Angular 4. Angular 4 provided us some new and interesting challenges – namely that the ballgame, and its associated rules which we had build our system around had changed. While we had completely redesigned our extensibility approach, which is outside of the scope of this document, we were faced with the very real problem of the 3rd party developer flow, which had seemingly degraded from Angular 1.x to 4.x under our design.. While I can’t go too far into the details, a lot of the 3rd party work had to be done out of band – integration testing with the core platform required round trips to the build server under our design just to get a working environment to test your enhancements (which may have been broken due to an errant keystroke that had gone unnoticed before pushing for the build – so you had to do it all over again).

As a stop-gap, we devised a new approach; though also far from optimal. As we should have, we shifted the burden from the 3rd party developers back to ourselves. How we accomplished this initially was via 2 different Angular npm packages of our core functionality. While we tried time and time again, we could never get “one library to rule them all”. What we could come up with was a system backed by 2 different builds of our core library. 1) The developer pacakge, which was capable of JIT with typing support, but only contained minified/obfuscated transpiled JavaScript housing the implementation details. 2) The build package, which supported AOT production builds, but contained unobfuscated logic and so could only be distributed to partnered builders with whom we had a legal agreement with concerning our IP.

This approach ‘worked’, but was never quite favored – it felt hacky and was difficult to maintain multiple builds…

Needless to say, we had to find a better way.

A Better Way

Enter Angular 6 – with it’s fancy first class support of library generation. Not quite knowing what we were getting into, a port of our 4.x to 6.x was undertaken – and went surprisingly well. From here we worked to break out all of our implementation which was intended to be ‘protected’ in to Angular Libraries (with the help of the Angular CLI and ng-packagr). Once our cleanup efforts were complete, we had a handful of Angular 6 feature libraries and what is essentially a shell application to tie them together.

While I am still struggling to grok the hows and whys that this works, it seemingly just does for now. In Angular 4 Land, we could never quite get our obfuscated/minified package to work for AOT Prod builds, though it worked perfectly fine for JIT builds; hence our need for 2 pacakges. But I am happy to report that the rules are apparently different in Angular 6 Land – as we are now able to create this ‘one package to rule them all’ in a relatively straight forward manner.

During some of the exploratory phase, I’d spoken on gitter with Alex Rickabaugh (@alxhub) about what we were trying to accomplish. While our interactions were small in regards to our Angular 4 efforts, I popped back in to update Alex on the success we’d found with Angular 6 – at which time he requested that I do a quick writeup in the case that it might assist others….

…so here we are…

Here be dragons…

As previously mentioned, the steps are currently pretty straight forward. For the following overview, let’s assume we arrived here from “ng g library awesomesauce”.
– “ng build awesomesauce –prod”
– Navigate to /dist/awesomesauce/
– Delete the esm5, esm2015, esm5, and fesm2015 folders.
– Navigate to /dist/bundles/ and delete the non *.min.* resources and the map associated with your minified bundle.
– Back in /dist/awesomesauce/, open up package.json and make the following edits:
– update ‘main’ to reference the *.min.js bundle in /bundles/
– Delete ‘module’, ‘es2015’, ‘esm5’, ‘esm2015’, ‘fesm5’ and ‘fesm2015’ key/value pairs
– “ng pack”

You are now the proud parent of a ‘secured’ Angular 6 library packaged for installation via NPM into an Angular 6 application – your bouncing new Angular library provides developer typing support for your public APIs, and which more importantly only contains minified/obfuscated implementation logic. Of course this isn’t 100% secure – you still have a considerable amount of information which is exposed in your *.d.ts typing files, and there’s still quite a bit that can be inferred in combination with your included metadata file (which is required for this all to work as described)… This said, I do believe that there’s little/nothing more exposed by this package than has always been the case with JavaScript libraries that provide typing support.

Note: Again, here be dragons. I am not a web security expert. The process described here may or may not stand up to rigorous scrutiny. We’re in the process of vetting this and working to clear the security requirements imposed upon us – but so far this appears to be fitting the bill for us, so perhaps it will for you too.

« Older posts Newer posts »

© 2024 blog.immatt

Theme by Anders NorenUp ↑